Exploration of what happened on 26th June this year
By: Simon Brooke :: 13 August 2026
Exploration of what happened on 26th June this year
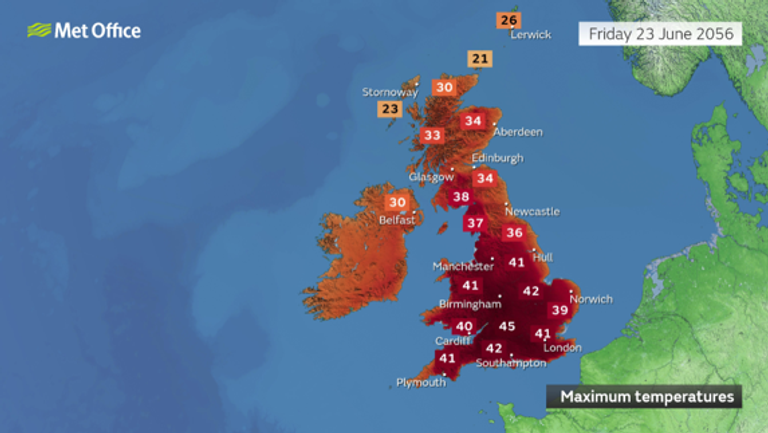
Back in June this year, the Meteorological Office posted a blog post that really alarmed me. Since then, I've published a series of blog posts:
Why was I alarmed? Because, given typical UK patterns of humidity, if we saw temperatures as high as those shown in the Met Office's projection, it seemed to me we must push wet bulb temperature beyond the limit of human survival. Was I right? The Met Office said not, but they did not explain why not.
The mathematics of humidity in the atmosphere are complex. But if I wanted to understand what was going on, I needed to be able to do that mathematics. So I did what I usually do when I'm faced with something very hard: I wrote a library, in Clojure, naturally.
This library is all my own work, and I've written it over only a few days. Although I have used, and documented, my sources, it may well be faulty, and any faults are entirely my responsibility. But it seems mostly good.
And it has allowed me to attack the problem. This blog post documents that attack, but, TL;DR, I was wrong, and the Met Office were right in saying that an 'everyone dies' event was most unlikely.
On June 26th 2026, at the peak of the second heatwave of the year, there is reported to have been sea mist coming ashore in southern England. What does that imply about inland humidity later in the day, and what happens if we project that forward to the 2056 numbers?
The Newquay → Bristol axis
Wind in Newquay starts southerly around dawn and veers south westerly through the morning, freshening from 17 kph at dawn to 28 at 10:50 and then veering further west and decreasing through the afternoon.
So that means air from Newquay will have been more or less over Bristol or Cardiff by 15:00.
Sunrise at Newquay was 05:06, sunset 21:31.
(def newquay-conditions-0650
(resolution :relative-humidity 100
:pressure-millibars 998
:temperature-celsius 18))
{:absolute-humidity 1536.0464352676404
:actual-vapour-pressure 235.7274339609213
:dew-point-celsius 18.000000000000004
:pressure-millibars 998
:pressure-pascals 99800
:relative-humidity 100
:saturation-vapour-pressure 2063.9199290840206
:temperature-celsius 18
:temperature-kelvin 291.15
:volume 1.0498554775257491
:wet-bulb-temperature 17.99603646423564}
That's useful. We have the observation of sea mist; the temperature is recorded as 18° Celsius, the relative humidity as 100%. That agrees with the observation, and also predicts that the wet bulb temperature of 18°, which is almost exactly the calculated value of 17.996. The fact that pressure is also almost exactly one bar is also convenient for validation. Consequently, since our 'volume' property is measured with reference to the volume at one bar, the fact that the calculated value is 1.05 is also validating the calculations.
(def bristol-conditions-1500
(resolution :relative-humidity 65
:pressure-millibars 993
:temperature-celsius 26))
{:absolute-humidity 1582.5712316313518
:actual-vapour-pressure 279.8315527542131
:dew-point-celsius 18.912533056621424
:pressure-millibars 993
:pressure-pascals 99300
:relative-humidity 65
:saturation-vapour-pressure 3361.325905991884
:temperature-celsius 26
:temperature-kelvin 299.15
:volume 1.0732982924086714
:wet-bulb-temperature 21.14280737522212}
To test my assumption that the absolute humidity of a body of air will not change (much) as it moves over land, let's use the absolute humidity observed at Newquay in conjunction with the temperature and pressure observed at Bristol, and the change of air volume implied by that, to project what I would expect the relative humidity and wet bulb temperature to be at Bristol:
(def projected-conditions-bristol-1500
  (resolution
  	:absolute-humidity
        (* (newquay-conditions-0650 :absolute-humidity)
            (/ (bristol-conditions-1500 :volume)
            (newquay-conditions-0650 :volume)))
	:pressure-millibars
		(bristol-conditions-1500 :pressure-millibars)
	:temperature-celsius
		(bristol-conditions-1500 :temperature-celsius)))

{:absolute-humidity 1570.3456821681918
	:actual-vapour-pressure 273.3960681915165
	:dew-point-celsius 18.788361981328976
	:pressure-millibars 993
	:pressure-pascals 99300
	:relative-humidity 64.49786733183173
	:saturation-vapour-pressure 3361.325905991884
	:temperature-celsius 26
	:temperature-kelvin 299.15
	:volume 1.0732982924086714
	:wet-bulb-temperature 21.06906305592025}
So what just happened?
Firstly, the temperature of the air increased from 19° C to 26°C, an increase of 7° C.
Second, the pressure actually fell slightly from 998 to 993 millibars (why?). So the change in volume of the air due to the changes in temperature and pressure was
(float (/ (bristol-conditions-1500 :volume)
(newquay-conditions-0650 :volume)))
1.0223296
a very small change. Nevertheless, we've plugged that change into our projection. The actual relative humidity at Bristol at 15:00 as recorded by Wunderground was
(bristol-conditions-1500 :relative-humidity)

65
whereas our projection is
(projected-conditions-bristol-1500 :relative-humidity)

64.49786733183173
which is close if very slightly conservative. The obeserved air over Bristol is very slightly wetter than I would have expected if this is the 'same air' as came ashore at Newquay.
However, this does tend to support my understanding.
The Weymouth → Oxford axis
Bristol is sort-of coastal, and not where the highest temperatures are to be expected. By contrast, Oxford is more inland, and close to where the hottest temperatures projected by the Met Office for 2056 are to be found.
So let's examine that axis. The interesting time is 09:00, when air is coming ashore with a relative humidity of 97%. But note that very humid air was continuing to come ashore all through the day.
The wind is west-south-west, so not blowing directly towards Oxford, but I'm going to assume it was since that's certainly feasible. It was blowing 26 kph at 09:00, increasing to 33 kph by 14:00. So it would travel the 150Km to Oxford in 6 hours.
(def weymouth-conditions-0900
	(resolution :relative-humidity 97
		:pressure-millibars 1008.9
		:temperature-celsius 17 ))

{:absolute-humidity 1403.6408980186827
	:actual-vapour-pressure 178.02031922401392
	:dew-point-celsius 16.520056918946594
	:pressure-millibars 1008.9
	:pressure-pascals 100890
	:relative-humidity 97
	:saturation-vapour-pressure 1937.6643982216053
	:temperature-celsius 17
	:temperature-kelvin 290.15
	:volume 1.0576765598814066
	:wet-bulb-temperature 16.635492040932025}
(def oxford-conditions-1520
	(resolution :relative-humidity 34
		:pressure-millibars 1004.18
		:temperature-celsius 33))

{:absolute-humidity 1210.4277088191022
	:actual-vapour-pressure 134.43778031798283
	:dew-point-celsius 15.057082547121334
	:pressure-millibars 1004.18
	:pressure-pascals 100418
	:relative-humidity 34
	:saturation-vapour-pressure 5029.975954996111
	:temperature-celsius 33
	:temperature-kelvin 306.15
	:volume 1.110779903781756
	:wet-bulb-temperature 21.576047081016238}

(def projected-conditions-oxford-1520
  (resolution
     :absolute-humidity
        (* (weymouth-conditions-0900 :absolute-humidity)
            (/ (oxford-conditions-1520 :volume)
            (weymouth-conditions-0900 :volume)))
	:pressure-millibars (oxford-conditions-1520 :pressure-millibars)
    :temperature-celsius (oxford-conditions-1520 :temperature-celsius)))

{:absolute-humidity 1474.11426213336
	:actual-vapour-pressure 242.88904915363867
	:dew-point-celsius 18.15876745576709
	:pressure-millibars 1004.18
	:pressure-pascals 100418
	:relative-humidity 41.40675609733967
	:saturation-vapour-pressure 5029.975954996111
	:temperature-celsius 33
	:temperature-kelvin 306.15
	:volume 1.110779903781756
 	:wet-bulb-temperature 23.181210505431324}
What happened here?
Here the air is substantially drier than expected. The absolute and relative humidity in the observed data is
[(oxford-conditions-1520 :absolute-humidity) (oxford-conditions-1520 :relative-humidity)]

[1210.4277088191022 34]
whereas in the projected data it is
[(projected-conditions-oxford-1520 :absolute-humidity) (projected-conditions-oxford-1520 :relative-humidity)]

[1474.11426213336 41.40675609733967]
if this is 'the same air', then we've lost about 260 grammes of water per cubic metre of air.
Again there's a change in volume
(/ (oxford-conditions-1520 :volume)
   (weymouth-conditions-0900 :volume))

1.0502075454015014
but, again, we've accounted for that.
So I don't know what's happening and, again, my understanding may be wrong. I would expect air over land in hot weather to show a slight increase in absolute humidity from evaporating dew, and from transpiration from green plants. Here, we're seeing a substantial decrease, and there's no precipitation in the record.
I don't understand this.
The 2056 projection
In the video embedded in their blog, the Met Office show their projected minimum temperatures for their 2056 'hottest day' at 46 seconds in. I'm going to assume this is at dawn.
Weymouth is shown as between 17° C and 20° C; and by interpolation I'm going to take 19° C.
(def weymouth-model-0600
	(resolution :temperature-celsius 19
		:pressure-millibars
			(weymouth-conditions-0900 :pressure-millibars)
		:relative-humidity
			(weymouth-conditions-0900 :relative-humidity)))


{:absolute-humidity 1580.8379174848048
	:actual-vapour-pressure 259.6100092541048
	:dew-point-celsius 18.512652842717483
	:pressure-millibars 1008.9
	:pressure-pascals 100890
	:relative-humidity 97
	:saturation-vapour-pressure 2197.3194803016
	:temperature-celsius 19
	:temperature-kelvin 292.15
	:volume 1.0649671100098326
	:wet-bulb-temperature 18.636936592419904}
Oxford is close to the peak temperature of 45° C shown on the Met Office's projected map. They don't give a time for this, but I'm going to assume mid-afternoon.
(def oxford_model-1500
	(resolution :temperature-celsius 45
		:pressure-millibars
			(oxford-conditions-1520 :pressure-millibars)
		:absolute-humidity
			(weymouth-model-0600 :absolute-humidity)))

{:absolute-humidity 1580.8379174848048
	:actual-vapour-pressure 338.20739537218424
	:dew-point-celsius 19.928237128232208
	:pressure-millibars 1004.18
	:pressure-pascals 100418
	:relative-humidity 24.223001514422226
	:saturation-vapour-pressure 9582.151230224688
	:temperature-celsius 45
	:temperature-kelvin 318.15
	:volume 1.1543185575311634
	:wet-bulb-temperature 27.72200125896371}
Note that, the conditions I've assumed here — that the absolute humidity will remain constant as the air moves from Weymouth to Oxford — are worse than in the observed data, where the air mysteriously dried.
Nevertheless, despite the high absolute humidity, the relative humidity remains at a survivable level:
(oxford_model-1500 :wet-bulb-temperature)

27.72200125896371
I think that this is the absolute 'worst case' for the Met Office projection, and it clearly does not imply a mass deaths event; so I was mistaken.